- Anomaly Detection
- Real-Time Dashboards
- Integrations
- Data Security, Privacy & Governance
- Scalability & Performance
Whether it's transactions, customer interactions, applications, connected devices, websites, sensors, vehicles, or operational systems, your business is producing data every second.

Follow the clues to see what is happening now!
The problem does not just lie in gathering that information. It is providing the correct information at the right time.
With ZechionAI Real-Time Data Processing & Analytics, organizations can avoid relying solely on end-of-day reports and manual reporting cycles to capture, process, enrich, analyze, and act on continuously generated data.
We develop the technology platform to enable every piece of real-time operational data to be transformed into actionable insights, from stream pipelines to event-driven processing, real-time dashboards, anomaly detection, AI-powered analytics, alerts and automated workflows.
A traditional report will tell you what happened yesterday.
This information is still relevant. However, for many operational decisions yesterday may be too late.
A customer makes a request. Payment is made. A car moves from one place to another. Inventory drops. A machine is making an odd reading. An exception is thrown for a delivery. User makes a critical action on the website.
These events are occurring on a regular basis.
ZechionAI can assist organizations in building systems that can:
- Capture
- Process
- Analyze
- Detect
- Understand
- Alert
- Act
The aim is not to create all the data real-time. It is about finding out where the right information will make a difference at the right time, and creating the right architecture to support the decisions.
What is Real-Time Data Processing & Real-Time Data Analytics?
Real time data processing is the collection and processing of data on the fly, as events are created, instead of waiting for large data batches to be created.
Real-time analytics uses analytical logic to this information to help organizations understand what is happening, recognize key events, track performance, spot unusual activity and make timely decisions.
This may be a full solution – it can consist of:
- 01
Real-Time Data Ingestion
Gather data from applications, databases, APIs, devices, websites, business systems, sensors and more in real-time.
- 02
Stream Processing
Take in events as they come and filter, transform, aggregate, enforce business rules and event logic.
- 03
Data Transformation
Normalize, validate, clean, structure and prepare incoming information for downstream analytics and systems.
- 04
Real-Time Analytics
Compute metrics, determine trends, analyze thresholds, detect patterns, and expose conditions of the operation.
- 05
Event Detection
Recognize predetermined events or sequences of events that call for action.
- 06
Real-Time Alerts
Alert to relevant persons, applications, or systems for important conditions.
- 07
Automated Actions
Activate workflows, updates, notifications, routing, etc. to operational actions.
- 08
Historical + Real-Time Intelligence
Use of current events to give context, not used alone as history.
The ZechionAI Real-Time Data Approach
ZechionAI's real-time analytics is not just a dashboard project, it's a data and technology environment.
- Data Sources
- Ingestion
- Streaming Layer
- Processing
- Enrichment
- Analytics
- AI / Machine Learning
- Visualization
- Alerts
- Automated Actions
- 01
Data Sources
Solutions can be designed based on information coming from:
- CRM systems
- ERP platforms
- Websites
- Mobile applications
- POS systems
- Databases
- APIs
- IoT devices
- Sensors
- Payment systems
- Logistics platforms
- Customer-support systems
- Business applications
- 02
Ingestion
Data is fed continuously from available sources by proper connectors, APIs, change data methods, event streams, etc.
- 03
Streaming Layer
A streaming architecture is one where events are streamed throughout the processing environment, allowing the processing to occur at "any time" and not just during scheduled batch runs.
- 04
Processing
The information received may be filtered, transformed, aggregated, validated, correlated, and evaluated with business rules.
- 05
Enrichment
The live events can be merged with customer, product, location, operational or historical data to give more context.
- 06
Analytics
The analytics layer is used for the calculation of KPIs, condition detection, pattern recognition, and giving out information related to particular operational decisions.
- 07
AI & Machine Learning
AI and machine learning may be used to assist in detecting anomalies, forecasting, classification, risk scoring, recommendations, and other analytical activities, as applicable.
- 08
Visualization
Executive dashboards, operational interfaces, applications, reports, geographic views and exception queues can all be used to present relevant information.
- 09
Alerts & Actions
Through connected systems, defined conditions can raise notifications and/or start approved workflows.
Real-Time Data Sources
ZechionAI can create real-time data environments for a wide variety of data sources such as:

- Application data
- Transaction data
- Customer activity
- Website events
- Mobile application events
- IoT data
- Sensor data
- Machine telemetry
- A GPS or location-based data.
- Logistics events
- Financial transactions
- Payment events
- Inventory changes
- CRM events
- ERP events
- Support tickets
- Contact-center events
- API events
- Database changes
- Security events
- Operational system events
The sources and how to integrate will vary based on API, connectors, permissions, infrastructure, data formats, security, and technology environment.
Accelerate the processing of real-time data
- 01
To create real-time data pipelines for development
Create and implement pipelines to continuously transport data from a source to a processing environment, analytical system, or downstream application.
- 02
Streaming Data Architecture
Design continuous data workloads, event driven applications, streaming analytics and scalable processing architectures.
- 03
Real-Time Data Integration
Integrate applications, APIs, databases, operating systems, devices and external data sources into a coherent data environment.
- 04
Event-Driven Architecture
Implement design systems that are driven by significant business events, not just by scheduled processes.
- 05
Stream Processing
Select, manipulate, summarize, compare and analyze streams of incoming information.
- 06
Real-Time Data Transformation
Normalize and process incoming information for reliable ingestion into analytics and operational systems.
- 07
Real-Time Data Enrichment
Integrate live events with context of customer, product, location, historical, or operational.
- 08
Real-Time Dashboards
Create real-time dashboards that deliver the right KPIs, operating conditions, exceptions, and trends to the right users.
- 09
Operational Intelligence
Provide operations teams with insight into what they are doing, process conditions, performance, and exceptions.
- 10
Real-Time Alerts & Notifications
Set thresholds, rules and warning conditions, or set significant events or business conditions.
- 11
Anomaly Detection
Detect non-normal behavior with business rules, statistical methods, machine learning, or a mix of these.
- 12
Real-Time Predictive Analytics
Use relevant analytical models to make estimates of future outcomes, risks or operational conditions based upon present or past data.
- 13
AI-Powered Real-Time Insights
Leverage AI and machine learning, when it adds practical value in interpreting real-time data, prioritizing events, identifying patterns, or supporting decisions.
- 14
Real-Time KPI Monitoring
Monitor and report on key business and operational metrics on an ongoing basis.
- 15
Customer Activity Analytics
Track customer behaviour, interactions, transactions, requests and signals in real time.
- 16
Fraud & Risk Monitoring
Enable real-time monitoring workflows for detecting suspicious activity or defined risk patterns.
- 17
IoT & Sensor Analytics
Continuously process information from connected devices, sensors, equipment, and other telemetry data sources.
- 18
Logistics & Fleet Analytics
Track movement, locations, trip events, utilization, exceptions, delays, operational conditions.
- 19
Real-Time Inventory Analytics
Track stock operations including inventory change, availability, replenishment signals and defined stock conditions.
- 20
Real-Time Financial Analytics
Track transactions, balances, financial events, operational measures, and other specified financial conditions.
- 21
Data Quality Monitoring
Find missing, late, duplicate, malformed, inconsistent or other problematic data.
- 22
Real-Time Data Governance
Set up proper controls on access, quality, lineage, retention, monitoring and responsible data use.
- 23
Historical + Real-Time Analytics
Mix real-time data with archived data to give both present and historical perspective.
- 24
Real-Time Analytics Optimization
Refine processing Architecture, Data Quality, Analytical Models, dashboards, workflows and operational performance continuously.
What’s discernible from Real-Time Analytics?
Real-time analytics may be used to discover:
- Sudden transaction changes
- Unusual customer activity
- Inventory thresholds
- Website conversion events
- Traffic spikes
- Operational delays
- Vehicle movement
- Delivery exceptions
- Equipment anomalies
- Sensor abnormalities
- Payment events
- Service disruptions
- System errors
- Security events
- Customer complaints
- SLA risks
- Capacity constraints
- Demand changes
- Revenue events
- Workflow failures
- Performance deviations
It can be based on simple business rules, statistical, machine learning or a mix of approaches.
Applications that businesses can use real-time data for
Monitor
Watch for the important operating conditions as they progress.
Detect
Recognize events, exceptions, changes and unusual patterns.
Alert
Share/transmit pertinent data to the right individual or system.
Predict
Apply appropriate analytical models to make predictions.
Respond
Start workflows automatically based on certain conditions.
Optimize
Make decisions about operations based on information.
Automate
Minimize manual tasks for suitable repetitive tasks.
Investigate
Provide teams with information and context to inform and support them to understand what has occurred and why.
How It Works
- 01
Discover
We know your data sources, your business processes, decision points, your reporting constraints, your operational constraints, and the goal of your business.
- 02
Assess
Existing infrastructure, data quality, integration, security, processing requirements and scalability is assessed.
- 03
Design
We specify the real-time data architecture, processing model, analytics framework, integration method and operational processes.
- 04
Connect
We connect relevant databases, API, apps, devices, platforms and business systems.
- 05
Process
We create pipelines, transformations, event logic, enrichment logic and data-quality controls.
- 06
Analyze
We create applicable dashboards, KPIs, alerts, models for anomaly detection, predictive models, and analytics.
- 07
Deploy
Data pipelines and analytics workloads are put into production in a suitable environment.
- 08
Monitor & Optimize
We track reliability, data quality, processing response time, analytical behavior, and business usage, and pinpoint opportunities for improvement.
Key Features

- Real-time data ingestion
- Streaming data processing
- Event-driven architecture
- Data transformation
- Data enrichment
- Real-time dashboards
- Live KPI monitoring
- Event detection
- Real-time alerts
- Anomaly detection
- Predictive analytics
- AI-powered insights
- Historical + real-time analysis
- API integration
- Database integration
- IoT integration
- Cloud data processing
- Data quality monitoring
- Data lineage
- Role-based access
- Auditability
- Security controls
- Scalable architecture
- Automated workflows
- Operational monitoring
Business Benefits

Improved access to information.
Minimize the need to manually prepare periodic reports where visibility is valuable.
Better Operational Visibility
Provide teams with a more up to date picture of relevant conditions in business.
Quickly locate and resolve exceptions
Have teams identify key events more near the time of the event so they can respond while the event can be acted upon.
More Informed Decisions
Integrate and apply known information to relevant history to enhance current decisions.
Reduced Manual Reporting
Implement some automation of appropriate data collection, processing, monitoring and reporting activities.
Improved Customer Experience
Be more responsive to customers' activity, service events, and operational change.
Better Resource Management
Utilize information to detect changes in capacity, utilization, demand and conditions of operations.
Early Risk Detection
Detect unusual activity or emerging issues based on business rules and/or analytical models.
Greater Operational Efficiency
Automate appropriate responses to repetitive events and minimize manual effort.
Scalable Data Intelligence
Create an architecture that will evolve with growth in size of data, systems, users, analytical needs, and business activities.
Actual results in business are dependent on the business's starting environment, implementation quality, adoption, data quality, use case, and operating model.
Why Outsource Real-Time Data Processing & Analytics to ZechionAI?
There are several special capabilities that may be necessary to build an effective real-time analytics environment.
Data engineers, streaming architects, cloud experts, integration developers, analysts, AI/ML engineers, security experts, dashboard builders, and operational support are among the skills that organizations may require.
For some organizations, it might be impractical to keep all of these skills within-house.
ZechionAI makes this happen through a coordinated engagement that encompasses:
- Data architecture
- Streaming data engineering
- Cloud architecture
- Data integration
- Event-driven systems
- Data quality engineering
- Analytics development
- Dashboard development
- AI/ML implementation
- Security-conscious architecture
- Governance support
- Production deployment
- Monitoring
- Continuous optimization
Not all businesses make outsourcing the optimal solution. The right model will vary based on your team, technology, size, internal expertise and data strategy.
Chief advantage of ZechionAI is being able to coordinate a technology partner to help integrate these capabilities into one practical solution.
Why Partner With ZechionAI?
Optimize an AI-powered digital twin of a product or asset across the entire data & AI lifecycle.
Take your organization from strategy and architecture to implementation, deployment, monitoring and optimization, and provide technical support and coordination.
- 01
Business-Focused Architecture
The answer to the question "what technology do we need to decide on" is linked to the business questions that you have to answer.
- 02
Integration-First Implementation
Real-time intelligence is based on your current systems and data environment, not a separate layer of analytics.
- 03
Real-Time + Historical Data Expertise
Construct solutions that incorporate present and historical context as appropriate.
- 04
AI & Analytics Capabilities
When AI and machine learning can offer tangible analytical benefits, use them; otherwise, avoid it.
- 05
Scalable Architecture
Plan for anticipated data volume, events per time unit, users, workloads, availability and future growth.
- 06
Security-Conscious Design
Incorporate access control, data handling, authentication, authorization, monitoring, and governance in the architecture.
- 07
Flexible Engagement Models
Begin with an evaluation, a specific use case, a full implementation, or a managed service.
- 08
Continuous Optimization
Ongoing data quality, processing behavior, analytical performance, and changing business needs are required in real-time environments.
- 09
Practical Implementation
Prioritize functionality, relevance, architecture and clarity of results.
- 10
Cross-Industry Experience
Use flexible data and AI engineering principles in various operations.
Leveraging Data for the Long Term: Data Intelligence Support.
Keep evolving real-time data capabilities—when systems, business processes, and analytical needs change.
Industries We Serve
All industries HealthcareOperate, support, monitor, and analyze patient flow, scheduling activity, resource utilization, claims and revenue-cycle analytics, and administrative events with proper privacy, security, and regulatory controls.
 Financial ServicesProvide the capability of handling the subject of transaction monitoring, risk signals, operational analytics, customer activity, fraud-monitoring workflows and financial event processing in accordance with applicable requirements.
- InsuranceEvaluate claims events, customer service encounters, workflow circumstances, risk signals, and operating efficiency.
 Retail & E-commerceTrack customer activity, inventory events, transactions, product performance, order processing and shopping behavior.
 Hospitality & TourismReview bookings, occupancy indicator, guest activity, service requests, operational conditions and revenue related events.
 Transportation & MobilityTrack fleet activity, GPS events, trip status, vehicle utilization, delivery events, delays and operational performance.
 Real EstateReview Lead activity, Property inquiries, Transaction events, Market information, Appointments activity and Portfolio data.
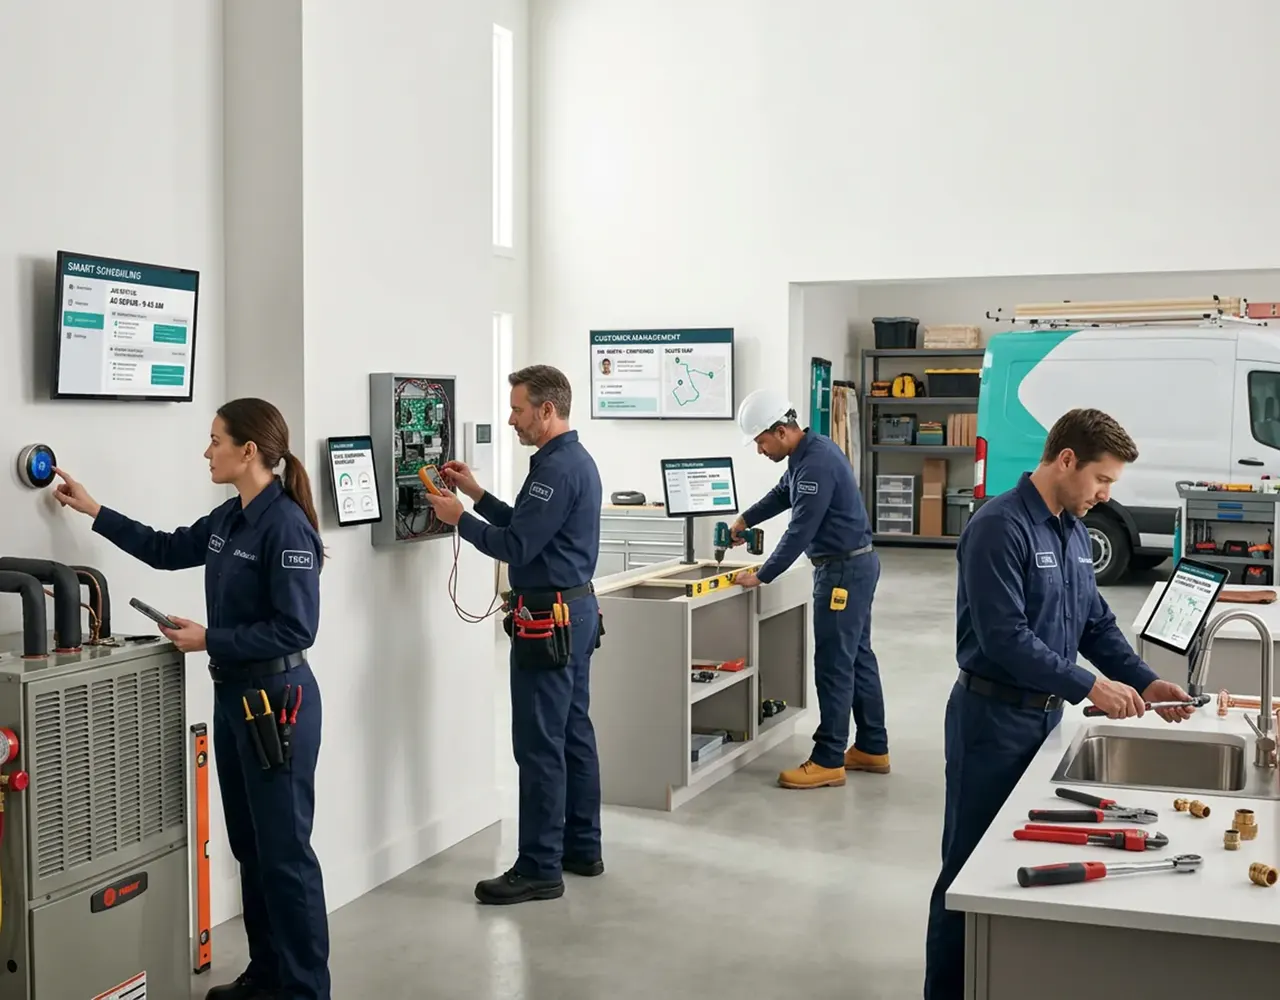 ManufacturingMachine telemetry, production data, equipment status, quality occurrences, maintenance alerts, and activities.
 Logistics & Supply ChainTrack shipment events, changes in inventory, fleet activity, delivery exceptions, warehouse activity and the conditions in the supply chain.
 Energy & UtilitiesInterpret equipment data, sensor streams, uses, usage, operational events, and asset conditions.
 TelecommunicationsTrack network occurrences, service performance, usage activity, customer interactions, and operating conditions.
 EducationEvaluate enrollment processes, learning-platform interactions, student interactions, administrative tasks, and institutional data.
 Construction & Facility ManagementTrack equipment activity, maintenance, work orders, occupancy, facility conditions, and operational activity.
 Food & BeverageExamine orders, changes in inventory, delivery events, customer activity, restaurant operations and demand signals.
 Corporate & Professional ServicesMonitor client activity, workflow events, employee operations, service performance, and business intelligence indicators.
Industry Use Cases
Real-Time Fraud Monitoring
Monitor defined transaction and behavioral signals to identify activity requiring investigation.
Customer Behavior Analytics
Track customer actions and interactions to understand engagement and identify important behavioral events.

Inventory Monitoring
Track inventory changes and threshold conditions to support replenishment and operational decisions.
Fleet Tracking
Process GPS and trip events to monitor vehicle locations, status, utilization, and exceptions.
Shipment Monitoring
Track shipment events and delivery conditions to identify delays or exceptions.
Equipment Monitoring
Analyze equipment telemetry and sensor data to identify changes requiring attention.
Website Behavior Analytics
Process live website events to monitor journeys, conversions, traffic patterns, and important customer actions.
Payment Event Monitoring
Monitor payment-related events and defined transaction conditions.
Operational KPI Monitoring
Give operations teams current visibility into business-critical performance indicators.
Customer-Service Analytics
Monitor support events, requests, response conditions, and service activity.
Revenue Monitoring
Track defined transaction and business events to provide more current visibility into revenue-related activity.
Capacity Monitoring
Monitor utilization and demand indicators to identify potential capacity constraints.
SLA Monitoring
Track operational events against defined service conditions and identify potential SLA risks.
Real-Time Data Processing & Analytics services
9 services
Anomaly Detection
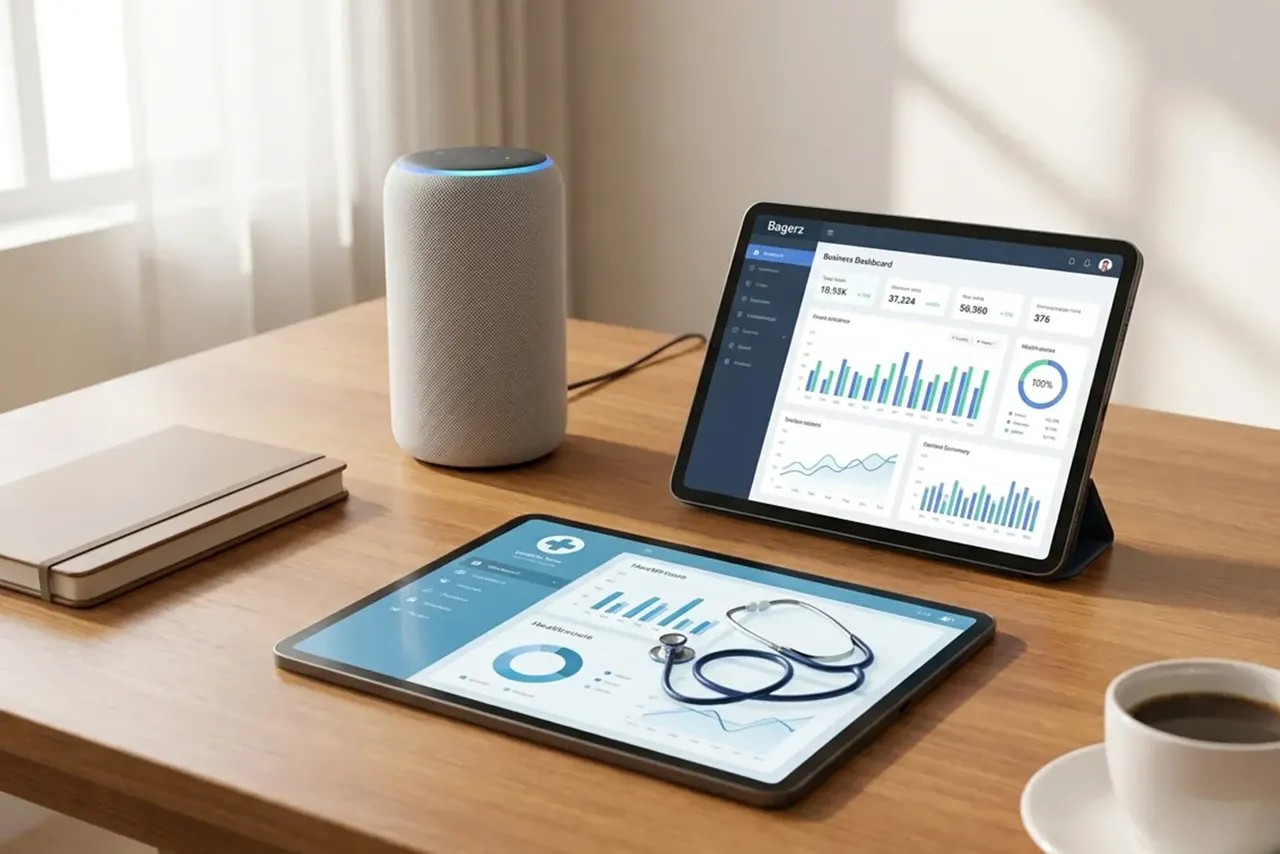
Identify deviations from expected activity using rules, statistical techniques, machine learning, or a combination of approaches.
Predictive Maintenance
Use equipment and historical information to identify patterns that may indicate maintenance requirements.
Demand Monitoring
Track current demand signals to support operational planning and forecasting.
Risk Monitoring
Monitor defined events and analytical signals associated with operational or financial risk.
Workflow Monitoring
Track process events to identify stalled, failed, delayed, or exceptional workflows.
Security Event Analytics
Aggregate and analyze relevant security events to support monitoring and investigation.
Executive Operational Dashboards
Provide leadership with a current view of selected business and operational indicators.
Real-Time Dashboards
A dashboard is the visible part of a real-time analytics solution — not the entire solution.
Behind a useful dashboard may be ingestion mechanisms, streaming infrastructure, data processing, enrichment, analytical logic, integrations, quality controls, and alerting workflows.
ZechionAI can design dashboards around the needs of different audiences, including:
- Executives
- Operations teams
- Data teams
- Customer-service teams
- Finance teams
- IT teams
- Field teams
Potential dashboard capabilities include:
- Live KPIs
- Operational status
- Event streams
- Trend analysis
- Geographic views
- Alerts
- Exception queues
- Customer activity
- Financial indicators
- Resource utilization
- System health
- Performance monitoring
The objective is to display the information each audience needs without overwhelming users with unnecessary data.
AI & Machine Learning for Real-Time Analytics
AI and machine learning can add value when live data needs more sophisticated interpretation than simple rules or thresholds can provide.
Potential applications include:
- Anomaly detection
- Predictive maintenance
- Demand forecasting
- Customer behavior prediction
- Risk scoring
- Fraud detection
- Classification
- Recommendation systems
- Event prioritization
- Intelligent alerting
- Pattern recognition
- Predictive operational analytics
Not every real-time analytics project requires AI.
In some environments, a straightforward rule-based event pipeline may be more appropriate, easier to explain, and easier to maintain.
ZechionAI evaluates the use case first and introduces AI where it provides meaningful analytical or operational value.
Integrations
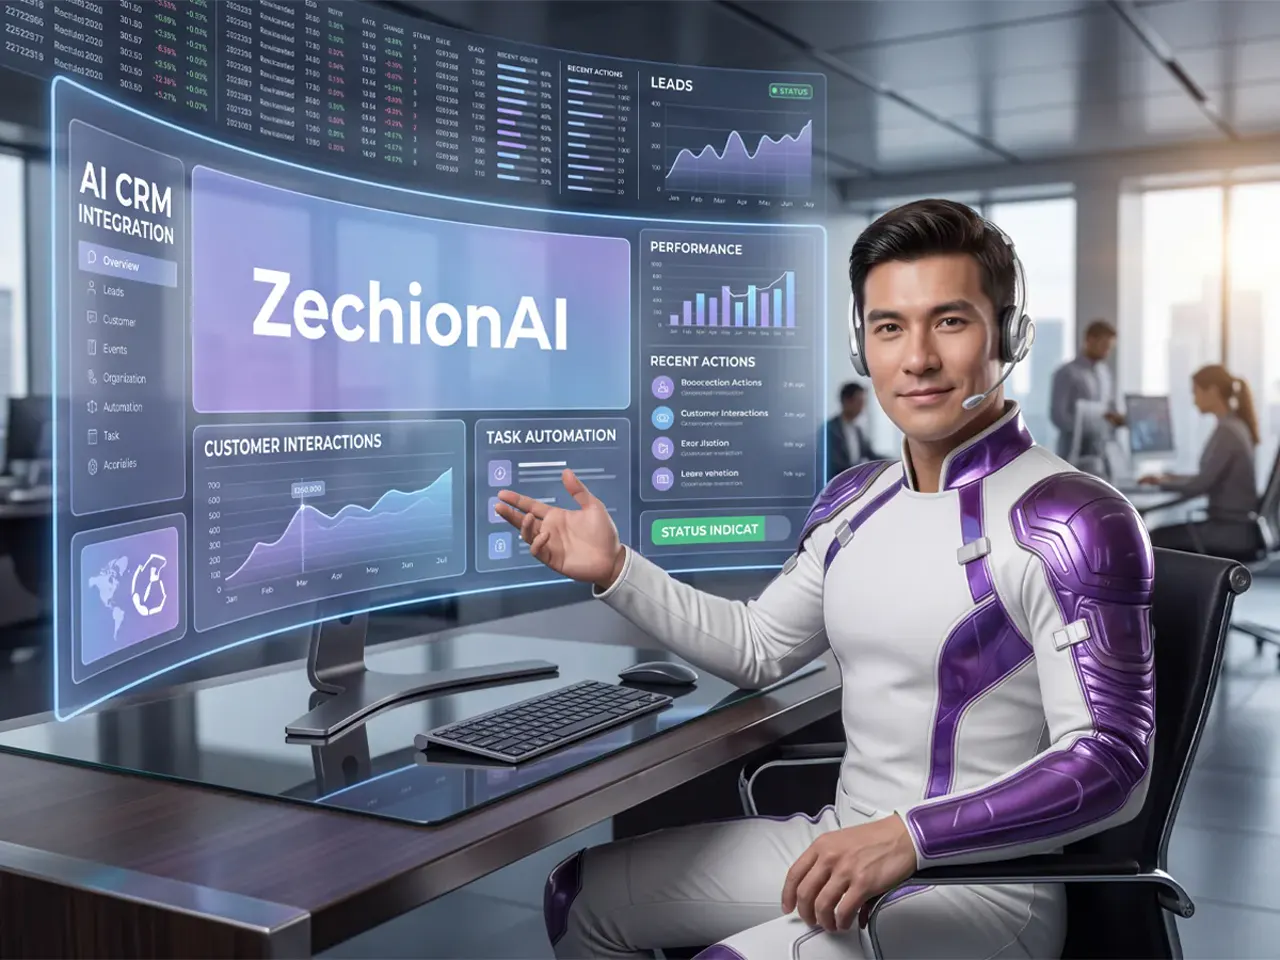
ZechionAI can design integration architectures around available:
- APIs
- Databases
- CRM systems
- ERP systems
- E-commerce systems
- Payment systems
- IoT platforms
- Sensor systems
- POS systems
- Logistics platforms
- Fleet systems
- Customer-service platforms
- Cloud data platforms
- Data warehouses
- Data lakes
- Business applications
- Event and messaging systems
Exact integration options depend on available APIs, connectors, permissions, data formats, infrastructure, security requirements, and the client's existing technology environment.
Data Security, Privacy & Governance
Real-time data environments can process sensitive and business-critical information. Security and governance therefore need to be considered as part of the architecture rather than added only after implementation.
Depending on the project, the environment may incorporate:
- Data access controls
- Authentication
- Authorization
- Encryption where applicable
- Data classification
- Data retention controls
- Data lineage
- Audit trails
- Role-based access
- Data-quality monitoring
- Secure integrations
- Sensitive-data handling
- Environment separation
- Monitoring and logging
- Governance policies
- Responsible AI controls
Regulatory and compliance obligations vary by industry, geography, data type, and implementation. Specific compliance requirements should be evaluated for each project.
Scalability & Performance
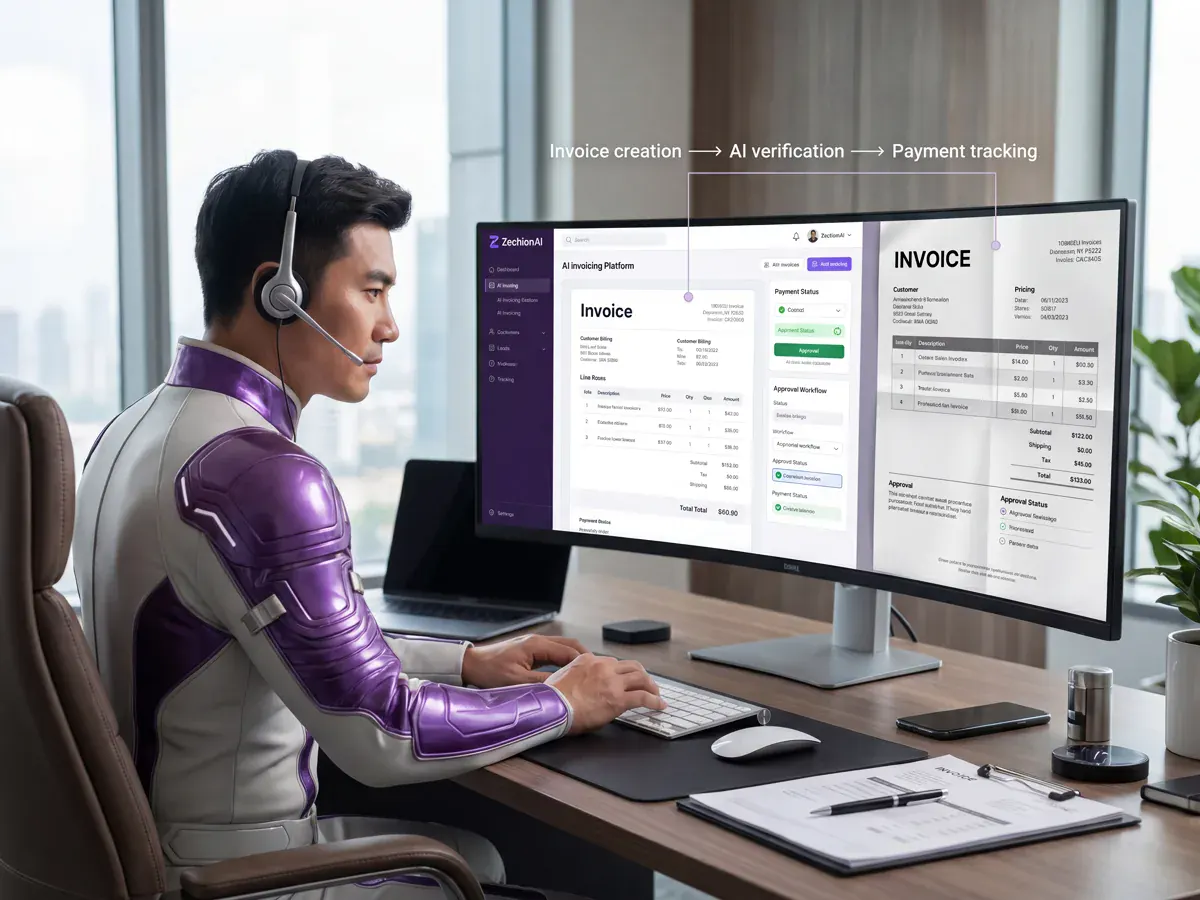
Real-time systems need to be designed around actual requirements.
That includes expected:
- Data volumes
- Event rates
- Processing requirements
- Availability requirements
- Transaction volumes
- Dashboard users
- Analytical workloads
- AI models
- Business-critical workflows
A scalable architecture should also consider:
- Increasing event volumes
- Additional data sources
- Additional business units
- Geographic expansion
- Additional analytical workloads
- Increasing dashboard users
- Cloud scalability
- Processing optimization
- Fault tolerance
- Monitoring
Performance should be established through the requirements and architecture of each specific implementation rather than through a generic latency or throughput promise.
Real-Time Analytics vs. Traditional Reporting
| Traditional Reporting | Real-Time Analytics |
|---|---|
| Periodic data collection | Continuous data ingestion |
| Scheduled processing | Event-driven processing |
| Primarily historical focus | Current operational visibility |
| Manual report preparation may be required | Automated dashboards and alerts |
| Decisions often based on past activity | Current + historical context |
| Exceptions may be identified after an event | Exceptions can be identified closer to when they occur |
| Designed primarily for reporting | Designed for monitoring, decisions, and response |
Real-time analytics does not eliminate the need for traditional reporting.
Most organizations benefit from both.
Historical reporting remains important for financial analysis, management reporting, trends, planning, audits, forecasting, and strategic decisions.
Real-time analytics complements those capabilities by providing visibility into what is happening now.
How Real-Time Data Supports Business Decisions
- Event
- Data
- Processing
- Insight
- Decision
- Action
Example 1 — Retail
Inventory falls below a defined threshold.
- Inventory event detected
- Data processed
- Threshold condition identified
- Procurement team alerted
- Replenishment workflow initiated
Example 2 — Transportation
A delivery encounters an operational exception.
- GPS/event data received
- Event processed
- Delay condition identified
- Operations team notified
- Customer communication workflow initiated
Example 3 — Manufacturing
Machine telemetry deviates from expected conditions.
- Sensor event received
- Data analyzed
- Potential anomaly identified
- Maintenance team alerted
- Inspection workflow initiated
These are illustrative examples. Actual workflows depend on the organization's systems, rules, data, permissions, and operating procedures.
Analytics & Reporting
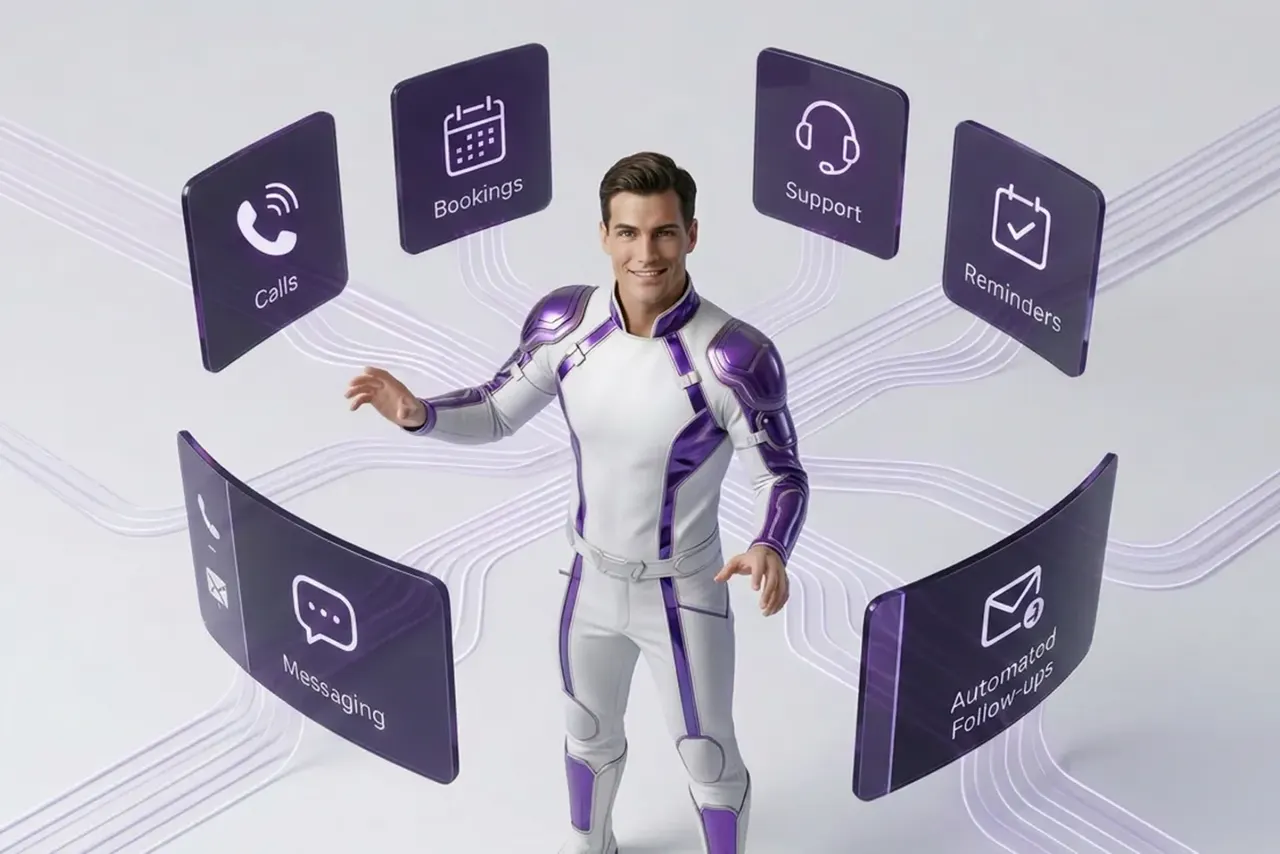
Real-time intelligence can coexist with traditional reporting.
ZechionAI can support:
- Real-time dashboards
- Historical reports
- Live KPIs
- Trend analysis
- Event analytics
- Exception reporting
- Anomaly reporting
- Predictive analytics
- Executive dashboards
- Operational dashboards
- Custom reporting
- Data exploration
This creates an analytical environment where decision-makers can move between:
What is happening now?
and
How does this compare with what happened before?
That combination can provide more useful context than either real-time or historical information alone.
Service Engagement Models
- 01
Real-Time Analytics Assessment
For organizations that want to identify high-value opportunities for real-time data processing.
- 02
Typical focus
Data sources, decision points, reporting limitations, architecture, integration requirements, and priority use cases.
- 03
Custom Data Platform Implementation
For organizations building or modernizing streaming and real-time analytics infrastructure.
- 04
Typical focus
Architecture, pipelines, integrations, processing, data quality, analytics, deployment, and monitoring.
- 05
Real-Time Analytics Development
For organizations requiring dashboards, alerts, event processing, AI models, integrations, and operational analytics.
- 06
Typical focus
Specific use cases and production-ready analytical capabilities.
- 07
Managed Real-Time Data Services
For organizations that want ongoing technical support.
- 08
Typical focus
Monitoring, optimization, maintenance, data-quality management, analytics improvements, and technical support.
- 09
Enterprise Data & AI Transformation
For organizations requiring broader real-time data and AI capabilities across multiple systems or business units.
- 10
Typical focus
Enterprise architecture, data strategy, streaming infrastructure, AI, analytics, governance, integration, and long-term transformation.
Stop Waiting for the Report. Start Understanding the Operation
Your organization already generates valuable data.
The question is whether that information reaches the people and systems that need it while it can still influence a decision.
ZechionAI can help identify where real-time data processing can improve visibility, monitoring, decision-making, analytics, and operational response — then design the technology required to support those objectives.
Related services
- Predictive AnalyticsTurn Historical and Real-Time Data Into Better Business Decisions
 Data & AI IntelligenceTurn Business Data Into Clearer Insights, Smarter Forecasts, and Better Decisions
- Fraud DetectionDetect Meaningful Risk. Reduce Unnecessary Friction. Strengthen Fraud Operations.
- Enterprise AI TransformationEnd-to-end AI transformation for large enterprises in the USA.
 AI Integration & APIsConnect Your Systems, APIs, Data & AI Into One Intelligent Business Ecosystem
- Recommendation EnginesAI Powered Recommendation Engine Services for more relevant customer experiences.
- AI Security, Governance & ComplianceSecure AI. Govern AI. Deploy AI Responsibly.
Real-time data processing involves collecting and processing data continuously as events are generated rather than waiting for scheduled batch-processing cycles. The appropriate definition of “real time” depends on the business requirement and system architecture.
Real-time analytics applies analytical logic to current or continuously arriving data to identify trends, events, exceptions, conditions, and other information that can support operational decisions.
Traditional reporting generally focuses on historical information collected and processed on a schedule. Real-time analytics focuses on current or continuously arriving information. Organizations commonly use both because they solve different business problems.
Potential sources include transactions, application events, APIs, databases, website activity, IoT devices, sensors, GPS information, inventory systems, payment platforms, CRM events, ERP events, and other operational systems.
Yes. ZechionAI can design database integration approaches based on the database technology, available access mechanisms, data structure, security requirements, infrastructure, and processing objectives.
Yes. API and application events can be incorporated into a real-time architecture when appropriate interfaces, authentication, permissions, data formats, and integration mechanisms are available.
Yes. IoT and sensor streams can be processed for applications such as equipment monitoring, operational analytics, anomaly detection, maintenance workflows, and asset monitoring.
Yes. Real-time environments can be designed to combine live events with historical datasets. This can provide context for trends, comparisons, anomaly detection, forecasting, and other analytical applications.
Yes. ZechionAI can develop dashboards for executives, operations, finance, IT, customer-service teams, field teams, and other audiences. Dashboard design is treated as one layer of a broader data and analytics environment.
Yes. Alerts can be configured around defined thresholds, business rules, event combinations, anomalies, or other conditions. Notifications can be delivered through appropriate connected systems.
Yes. AI and machine learning can be applied to live data for use cases such as anomaly detection, classification, prediction, recommendations, risk scoring, and event prioritization. AI is used where it provides meaningful value.
Yes. Depending on the use case, anomaly detection can use rules, statistical methods, machine learning, or a combination of approaches. The quality of detection depends on data quality, available historical information, model design, and the business context.
Yes. Equipment telemetry and historical maintenance information can be analyzed to identify patterns that may indicate changing equipment conditions. The appropriate approach depends on the equipment, available data, operating environment, and maintenance objectives.
Potentially, yes. Integration depends on the specific platform, APIs, connectors, permissions, data structures, security requirements, and client environment. Integration options are assessed during the discovery and architecture stages.
Yes. Where appropriate, detected events can trigger approved workflows such as notifications, routing, system updates, case creation, escalation, or other automated actions. Automation should be designed around clearly defined business rules and appropriate controls.
Data-quality controls can identify missing, duplicated, malformed, inconsistent, delayed, or otherwise problematic information. Validation, transformation, monitoring, reconciliation, and exception handling can be incorporated into the architecture.
Security measures may include authentication, authorization, access controls, encryption where applicable, environment separation, auditability, logging, monitoring, secure integrations, and governance controls. Specific safeguards depend on the data and system requirements.
Real-time architectures can be designed with scalability in mind, including increasing event volumes, data sources, users, analytical workloads, and geographic requirements. Actual scalability depends on the selected architecture, infrastructure, workload characteristics, and operational design.
No. Real-time analytics is most useful when timely information can materially improve monitoring, decisions, customer experience, risk management, operational response, or automation. Some business processes are better served by scheduled or historical reporting.
Implementation timelines vary considerably. Factors include the number and complexity of data sources, integration requirements, data quality, architecture, security requirements, use cases, dashboards, AI models, testing, deployment, and organizational readiness. A focused use case may require a very different timeline from an enterprise-wide data transformation.