
AI-Powered Data Analytics & Dashboards
Turn Business Data Into Clearer Insights, Smarter Forecasts, and Better Decisions
Talk to Zech, live
- Data Integration & Preparation
- Advanced Data Visualization
- Automated Reporting & Insights
- Natural Language Analytics
- Anomaly & Fraud Analytics
Your business already generates huge amounts of information, from ERP and CRM systems to marketing platforms, finance platforms and operational applications and spreadsheets, databases and cloud-based platforms.

When Business Data Becomes Harder to Use Than It Should Be
The issue is usually not the lack of information.
The trick is to transform the data into information that your team can trust, and make decisions your company can make based on it.
ZechionAI aids organizations to connect disparate data Modernize business intelligence, automate reporting, design interactive dashboards, recognize crucial patterns, forecast future outcomes and then apply AI to daily analytics.
In everything from executive reports to monitoring of operations in real-time Analytics solutions are designed to help you make the right decisions your company requires to take, not merely around dashboards that are easy to create.
Strategies, data integration Data integration, AI analytics, forecasting as well as governance and automation - all designed in the context of your organization.
Many companies have a wealth of data, yet they have a difficult time answering basic business-related questions in a timely manner.
The sales team of your company may have one pipeline performance, whereas finance has a different. Operations might be using spreadsheets that were last updated. Executives could wait until the final day of the month to get reports which are expected to be released in the next few hours.
Common problems are:
- Data is spread across ERP, CRM Marketing, finance HR, operational systems
- Manual spreadsheet-based reports
- Different departments using different KPI definitions
- Reports that require days to complete
- Insufficient real-time visibility
- Quality of data and issues with consistency
- Legacy BI environments
- It is difficult to forecast revenue and sales.
- Uncertain understanding of customer behavior
- The difficulty in identifying irregular transactions or operational issues
- Teams of reporters spend too much time creating data, instead of actually analyzing it
- Data silos between departments
- Uncertain control of the business's metrics
- The difficulty of turning old reports into forward-looking information
- Executives are receiving too much information, but not sufficient context
A dashboard alone will not fix these issues.
The data and metrics, business logic the governance, user experience and analytical models all play a role.
From Raw Data to Better Business Decisions
ZechionAI assists organizations in establishing an efficient lifecycle for analytics:
- Raw Data
- Connected Data
- Trusted Analytics
- AI Insights
- Better Decisions
We can help you bring data from systems you use already and make it available for analysis, design relevant KPIs and create decision-based dashboards and then introduce AI in situations where it could be of value in the real world.
Depending on your business needs the analytics can be helpful:
- Find important information more quickly
- Establish more consistent KPI definitions
- Reduce repetitive reporting work
- Enhance management visibility
- Recognize trends and outliers earlier
- Make more informed forecasts
- Learn to recognize the behavior of customers
- Review operational and financial performance
- Enhance resource planning
- Make sure you are making decisions based on evidence
- Build a foundation that can be scaled to support advanced analytics as well as AI
The aim isn't to deploy AI everywhere.
It's to make use of analytics, data and AI in order to assist people make better decisions.
What ZechionAI Delivers
ZechionAI is able to support the entire analytics lifecycle, which includes:
- AI Data Analytics Strategy & Consulting
- Data Integration & Preparation
- AI-Powered Business Intelligence
- Interactive BI Dashboard Development
- Predictive Analytics & Forecasting
- Prescriptive Analytics & Decision Intelligence
- Real-Time Analytics & Monitoring
- Advanced Data Visualization
- Automated Reporting & Insights
- Natural Language Analytics
- Anomaly & Fraud Analytics
- Customer & Marketing Analytics
- Sales & Revenue Analytics
- Financial & Business Performance Analytics
- Supply Chain & Operations Analytics
- Workforce & HR Analytics
- Data Warehouse & Lakehouse Analytics
- BI Platform Implementation & Integration
- AI Analytics Automation
- Enterprise Analytics Governance & Security
Our AI-Powered Data Analytics & Dashboard Services
20 services
AI Data Analytics Strategy & Consulting

Analytical projects can be more efficient when they are based on the business goals rather than with technology.
What We Provide
- Data & Analytics Strategy
- AI Analytics Roadmap
- BI Transformation Consulting
- Data Maturity Assessment
- Analytics Use-Case Identification
- KPI & Metrics Strategy
- Data Governance & Analytics Advisory
ZechionAI assists organizations in determining what data initiatives merit consideration, which KPIs are crucial as well as which analytical capabilities are required and the areas where AI could be able to provide value.
What We Solve
Companies often make investments in dashboards without clarifying the goals that these dashboards must be able to support. We assist in establishing a concrete plan that links analytics investments to the business goals.
Our Approach
We analyze your current conditions and the business goals, your the state of your data, the technology landscape reports, and gaps in your analytical capabilities. We then help determine the best approach based on your business importance feasibility, the feasibility, readiness for data, and the expected benefits.
Data Integration & Preparation

Reliable analytics depends on reliable data.
Sub-Services
- Multi-Source Data Integration
- ETL/ELT Pipelines
- Data Cleaning & Transformation
- Data Consolidation
- API & Database Integration
- Cloud Data Integration
- Real-Time Data Integration
ZechionAI assists organizations in bringing information into systems they already have and create a consistent report and analysis.
We use data from ERP, CRM marketing, accounting HR operating systems, databases APIs as well as spreadsheets, cloud platforms, and various other business software.
The aim is to develop an enduring data base for dashboards, reports analytics, dashboards, and AI models.
AI-Powered Business Intelligence
Traditional BI typically helps companies understand the events that took place.
Sub-Services
- AI-Enhanced BI Solutions
- Automated Business Reporting
- Intelligent KPI Monitoring
- AI-Generated Business Insights
- Automated Data Interpretation
- Executive Intelligence Dashboards
- Natural Language BI & Querying
AI-enhanced BI has capabilities to help teams recognize patterns, interpret data to identify patterns, track exceptions, and investigate questions more effectively.
For instance instead of merely displaying that revenue has decreased the AI-assisted environment for analytics could help pinpoint the specific products, regions, clients or times that were that are impacted by the change.
AI-generated insight should be verified against reliable data and business rules as well as the appropriate judgment of a human.
Interactive BI Dashboard Development
A well-designed dashboard can aid in answering an important question in a short time.
Dashboard Services
- Executive Dashboards
- Operational Dashboards
- Financial Dashboards
- Sales & Marketing Dashboards
- Customer Analytics Dashboards
- Workforce Dashboards
- Industry-Specific Dashboards
- Custom KPI Dashboards
ZechionAI creates dashboards based on the details that different users really have to be monitoring and acting on.
Dashboards can contain:
- Views based on role
- KPI scorecards
- Interactive filters
- Drill-down function
- Trend analysis
- Views from different perspectives
- Exception indicators
- Analysis of the period-over-period
- Automated refreshes
- Mobile-friendly experiences, where the appropriate
We place a high value on usability and decision-making over attractive visualization.
Predictive Analytics & Forecasting
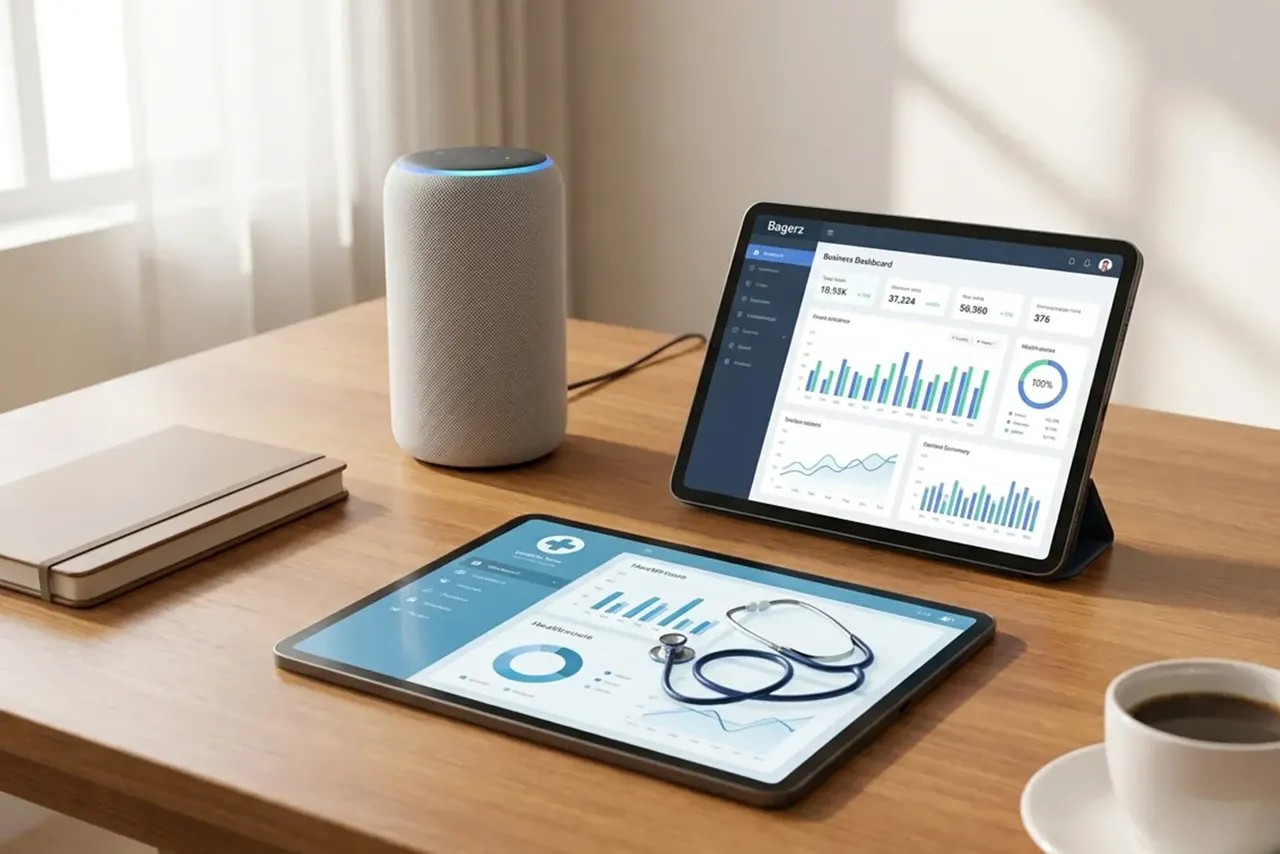
The historical data is more than a history of events that have already occurred.
Sub-Services
- Sales Forecasting
- Revenue Forecasting
- Demand Forecasting
- Customer Churn Prediction
- Risk Prediction
- Inventory Forecasting
- Workforce Forecasting
- Predictive KPI Analysis
With the right information and methods for modeling, companies can make use of data from the past and present to determine the potential outcomes for the future.
Forecasts are a great tool to plan for sales as well as inventory, demand staffing, retention of customers, and many other business-related factors.
Predictive analytics provides probabilistic estimates but no promises. Forecast accuracy is contingent upon the quality of data, the design historic patterns, external conditions, as well as how often the model is reviewed and updated.
Prescriptive Analytics & Decision Intelligence

Many companies are looking to use analytics that go beyond just reporting.
Sub-Services
- AI-Based Recommendations
- What-If Analysis
- Scenario Modeling
- Decision Optimization
- Resource Allocation Analytics
- Business Simulation
- Automated Decision Support
Prescriptive analytics focus on the evaluation of possible actions and helps people decide on what's important to take the next time.
This can be described as follows:
What was the cause? What caused it? What might happen? What are the options?
For instance, a business might model how changes in pricing or staffing levels, inventory or sales allocations could impact future business outcomes.
Real-Time Analytics & Monitoring
Certain business decisions are not waiting for a daily or monthly report.
Sub-Services
- Real-Time KPI Dashboards
- Live Operational Monitoring
- Streaming Data Analytics
- Real-Time Alerts & Notifications
- Performance Monitoring
- Anomaly Detection
- Event-Based Analytics
ZechionAI can assist organizations in monitoring important business activities through an analytics environment that is built around up-to-date or regularly updated information.
Real-time analytics are a great tool to support operational settings where changes to transactions, orders fleet activities, system events, production or customer activities require prompt attention.
Advanced Data Visualization

Visualization can help people understand information, not just making a dashboard look stunning.
Sub-Services
- Interactive Data Visualization
- KPI Scorecards
- Trend Analysis
- Geographic & Location Analytics
- Drill-Down Analytics
- Comparative Analytics
- Automated Visualization
- Custom Data Storytelling
We design visualisations around the question that the user has to be able to.
This could mean a basic KPI card or a trend line, the view of the world funnel as well as a variance analysis or a more sophisticated interactive visualization.
Automated Reporting & Insights

Teams that report should not be required to rewrite the same report each week.
Sub-Services
- Automated Management Reports
- Scheduled BI Reports
- AI-Generated Executive Summaries
- Automated KPI Reports
- Exception Reporting
- Performance Reports
- Board & Investor Reporting
ZechionAI assists in automatizing recurring reporting procedures while increasing the consistency of reporting and decreasing repetitive analytical work.
Automated reporting allows you to distribute accurate information to the appropriate audience according to a set schedule, while giving analysts more on interpretation and support for decision making.
Natural Language Analytics

Natural-language analytics allow authorized users to communicate with data from businesses in a normal way, rather than having to be able to comprehend complicated query structures or database syntax.
Sub-Services
- Ask-Your-Data Interfaces
- Natural Language Queries
- Conversational BI
- AI Data Assistants
- Text-to-SQL Analytics
- Voice-Enabled Analytics
- Automated Insight Generation
A business person might want to know:
"How did sales perform this quarter compared with the same quarter last year?"
Or:
"Which regions experienced the largest decline in pipeline?"
The system is able to convert an approved query into an appropriate query for analysis and return information in a comprehensible format.
But, natural-language analytics needs proper permissions, trustworthy data as well as validation and governance. AI shouldn't be considered as an unrestricted source for truth.
Anomaly & Fraud Analytics
Analytics can assist organizations in identifying odd patterns that merit an investigation.
Sub-Services
- Business Anomaly Detection
- Financial Anomaly Detection
- Transaction Monitoring
- Fraud Pattern Detection
- Revenue Leakage Detection
- Operational Exception Detection
- Risk Analytics
Examples include transactions that are unusually large or unexpected changes in purchasing behaviors, unusual operational activities as well as revenue pattern patterns which are substantially from the historical norms.
Anomaly detection detects patterns that merit an investigation. It is not a guarantee that there was fraud or wrongdoing.
Customer & Marketing Analytics

Understanding the needs of customers goes beyond simply counting the number of visits to websites or transactions.
Sub-Services
- Customer Segmentation
- Customer Lifetime Value Analytics
- Churn Analytics
- Customer Journey Analytics
- Marketing Performance Analytics
- Campaign Analytics
- Conversion Analytics
- Personalization Analytics
ZechionAI aids organizations to analyze customer behavior segmentation, marketing performance retention, and conversion.
Analytics can be used to solve problems such as:
- Which customer segments are the most valuable?
- Where do customers leave their journey?
- Which campaigns have produced high-quality potential?
- Which segments have higher retention?
- How does customer acquisition change in the course of time?
Sales & Revenue Analytics
Sales managers need to be aware of their current performance as well as future revenue growth potential.
Sub-Services
- Sales Performance Dashboards
- Pipeline Analytics
- Lead Conversion Analytics
- Territory Analytics
- Sales Forecasting
- Revenue Intelligence
- Pricing Analytics
- Customer Acquisition Analytics
We assist organizations in analysing pipeline movement as well as sales cycles, conversion territories performance, pricing, acquisition of customers, and sales trends.
It's a more integrated perspective of sales activities and revenue plan.
Financial & Business Performance Analytics
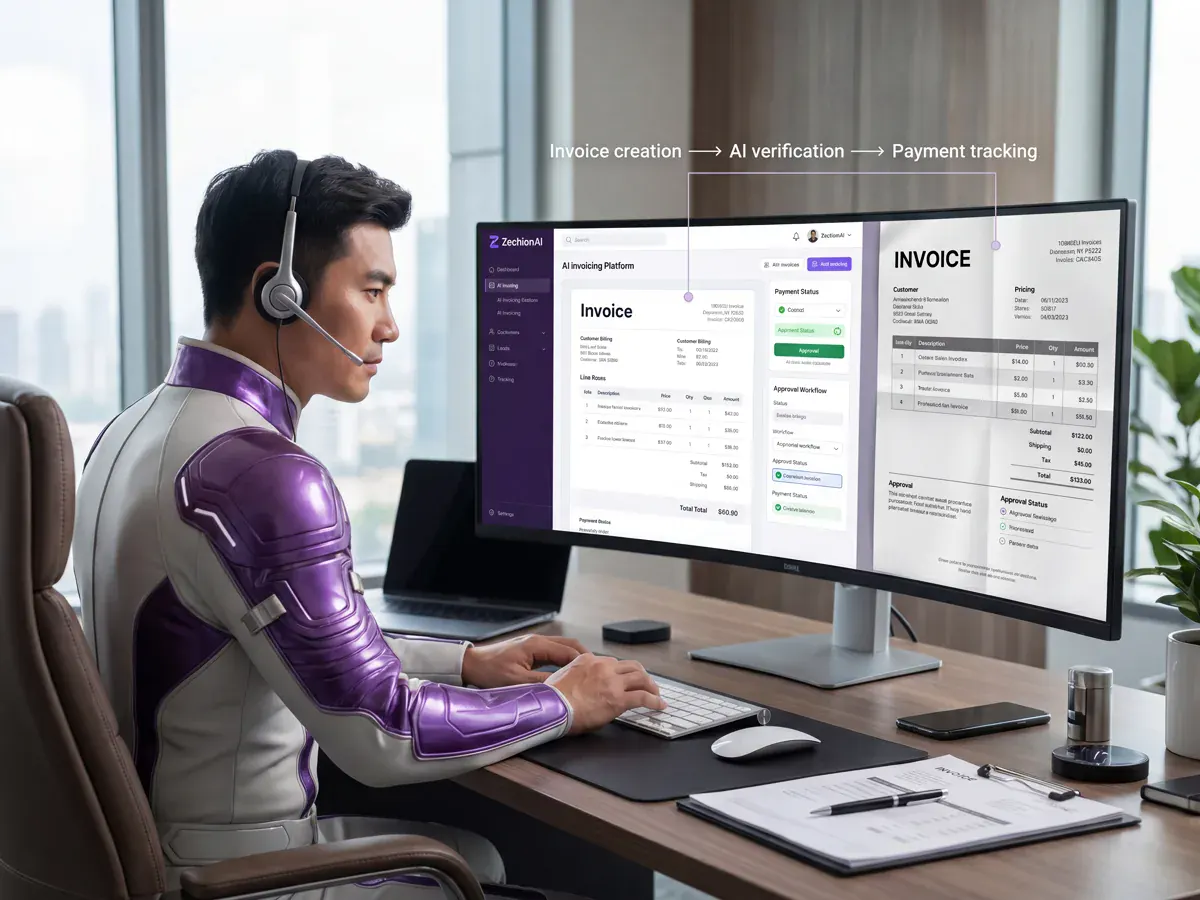
Executives and finance teams require more than just static financial statements.
Sub-Services
- Financial Dashboards
- Profitability Analytics
- Cash Flow Analytics
- Cost vs. Actual Analysis
- Cost Analytics
- Margin Analysis
- Financial Forecasting
- Business Performance Management
Analytics can give an enhanced view of the profitability, costs and budgets, cash flow, margins, and overall business performance.
The ability of organizations to use these capabilities is to identify areas how performance is changing, and when management attention might be needed.
Supply Chain & Operations Analytics
Operational Analytics connects activities across inventory, purchasing logistical manufacturing, suppliers and fulfillment.
Sub-Services
- Supply Chain Dashboards
- Inventory Analytics
- Procurement Analytics
- Logistics Analytics
- Supplier Performance Analytics
- Operational Efficiency Analytics
- Demand Planning
- Capacity Analytics
These tools can help teams to identify bottlenecks, assess the performance of suppliers, assess inventory levels, analyze patterns of demand and enhance operations planning.
Workforce & HR Analytics
The data on the workforce can help employers to understand the staffing requirements and retention, recruitment utilization and plan for workforce development.
Sub-Services
- Workforce Dashboards
- Employee Performance Analytics
- Workforce Planning
- Attrition & Retention Analytics
- Recruitment Analytics
- Attendance & Productivity Analytics
- Compensation Analytics
- Workforce Forecasting
Workforce analytics should be used in a responsible manner, with appropriate privacy safeguards, access controls and governance, as well as the consideration of how information about employees is employed.
Data Warehouse & Lakehouse Analytics
Scalable analytics require an architecture capable of supporting the growing volume of data as well as the demands of users, reporting and analysis workloads.
Sub-Services
- Cloud Data Warehousing
- Data Lake & Lakehouse Analytics
- Analytics Data Models
- Dimensional Modeling
- Data Marts
- Enterprise Data Architecture
- Analytics-Ready Data Pipelines
ZechionAI helps organizations create structured data that is ready for analytics. It can be used to help with dashboards, reporting as well as predictive models and AI applications.
BI Platform Implementation & Integration
Companies do not have to always to completely replace their current BI system.
In most instances it is best to integrate, improve or modernize what's currently working.
Platform & Integration Services
- Microsoft Power BI Solutions
- Tableau BI Solutions
- Looker & Looker Studio Solutions
- Custom BI Platforms
- CRM & ERP BI Integration
- BI Platform Migration
- Dashboard Modernization
- Embedded Analytics
The right platform is dependent on your current infrastructure as well as the users you have security requirements and budget, analysis requirements and a long-term strategy.
AI Analytics Automation
Teams in analytics often spend significant time doing repetitive tasks that are partially automated.
Sub-Services
- Automated Data Analysis
- Automated Insight Discovery
- Automated Report Generation
- AI-Powered KPI Monitoring
- Intelligent Alerting
- Automated Forecasting
- Analytics Workflow Automation
ZechionAI helps to identify opportunities to automatize analytics.
Automation can cut down on repetitive work but still allowing human oversight for business-related decisions that require context, judgment or approval.
Enterprise Analytics Governance & Security

Analytics is more valuable when more people access it. However, the greater access also enhances the importance of governance.
Sub-Services
- Analytics Governance
- Role-Based Dashboard Access
- Data Security Controls
- Data Quality Monitoring
- Audit & Compliance Analytics
- Data Lineage
- Analytics Access Management
- Enterprise BI Governance
ZechionAI is a security-focused AI that considers permissions, security and data quality, as well as lineage and governance, auditability and accountable AI in the design of analytics environments.
For organizations that are regulated, the implementations must be in line with the applicable policies of the organization and with regulatory regulations.
Dashboard Types We Build
Different users need different information.
ZechionAI can build dashboards around departmental, executive, operational customer, financial, and other industry-specific needs.
- 01
Executive & Leadership
- CEO Dashboards
- CFO Dashboards
- COO Dashboards
- Executive Performance Dashboards
- Board Reporting Dashboards
- 02
Departmental
- Sales Dashboards
- Marketing Dashboards
- Finance Dashboards
- Operations Dashboards
- HR Dashboards
- Customer Dashboards
- Supply Chain Dashboards
- 03
Specialized
- Project Dashboards
- Real-Time Monitoring Dashboards
- Industry-Specific Dashboards
- Embedded Analytics
- Custom KPI Dashboards
The design of the dashboard can be modified according to user roles as well as KPIs and workflows, data sources as well as permissions and other decisions that require support.
AI & Analytics Technology Capabilities
ZechionAI is capable of working with different technologies based on the specific business requirements.
AI & Advanced Analytics
- Machine Learning
- Generative AI
- Predictive Analytics
- Prescriptive Analytics
- Natural Language Processing
- Natural Language Querying
- Text-to-SQL
- Anomaly Detection
Data & BI
- Data Visualization
- Data Warehousing
- Data Lakes
- Lakehouses
- ETL/ELT
- Data Modeling
- APIs
- Cloud Data Platforms
- Business Intelligence Platforms
- Analytics Automation
Governance & Enterprise Capabilities
- Role-Based Access
- Data Governance
- Data Quality
- Data Lineage
- Auditability
- Responsible AI
- Security Controls
BI Platforms
- Microsoft Power BI
- Tableau
- Looker
- Looker Studio
The technology stack you choose to use is determined based on the infrastructure you have in place and information volume, security needs and business requirements as well as budget and the use the case.
Key Dashboard & Analytics Features
Based on the type of project, analytics solutions could be:
- Interactive dashboards
- Drill-down analytics
- KPI scorecards
- Automated reporting
- AI-generated insights
- Predictive forecasting
- Scenario analysis
- Natural-language queries
- Monitoring in real time
- Automated alerts
- Anomaly detection
- Access based on role
- Data integration
- Mobile-friendly dashboards
- Scheduled reports
- Custom-designed visualizations
- Executive summary
- Analytics embedded into the embedded
- Data quality monitoring
- Audit trails if needed
Business Use Cases
Executive Performance Monitoring
Business Problem: Leadership teams receive reports in fragmented form from several departments.
Analytics Solution Consolidated executive dashboards incorporating standard KPIs and drill-down capabilities.
The potential business value: Greater insight into performance and clearer recognition of areas that require attention from management.
Sales Forecasting
Business Problem: Revenue planning relies heavily on spreadsheets that are maintained manually.
Analytics Solution Integration of CRM and sales data with forecasting models, pipeline dashboards.
Potent Business Value organized forecasting and greater visibility into pipeline potential and risks.
Customer Churn Analysis
- Business Challenge: Losses to customers are discovered after they have occurred.
- Analytics Solutions: Customers' behavior such as engagement, transaction and support information analyzed for patterns that indicate risk to retention.
- The potential business value: earlier detection of customers who might need to be contacted.
Marketing Performance
- Business Problem: Marketing information is distributed across CRM, advertising web analytics, campaigns platforms.
- Analytics Solutions: Consolidated performance of marketing dashboards and analytics on customer journeys.
- The potential business value: Greater insight into the performance of campaigns and conversion rates, as well as acquisition costs and customer behaviour.
Financial Performance
- Business Problem: Finance and operating teams require regular monitoring of the actual performance versus goals.
- Analytics Solutions: Dashboards for financial transactions that include margins, revenue, expenses cash flow, budget variance.
Possible Business Value Accessible information on financials for making management decisions.
Inventory Planning
Business Challenge: Decisions about inventory are based on primarily historic reports and estimates made by hand.
Analytics Solution includes inventory, demand and sales, procurement and supplier information analyzed via forecasting models and dashboards.
Potential Business Value: More insight into patterns of demand as well as inventory management.
Revenue Leakage Detection
- Business Challenge: Small bills or pricing, transactions, or operational deviations are difficult to determine by hand.
- Analytics Solution: Automation of Analytics and anomaly detection in relation to relevant transaction and data on revenue.
- The potential business value: Speedier detection of patterns that are unusual for research.
Workforce Planning
- A Business Issue: The Staffing requirements be adjusted as demand increases.
- Analytics Solution: Demand for work, operational and productivity, scheduling and staffing history data all analyzed.
- Potential Business Value: Better understanding of the planning of workforces and the allocation of resources.
Industries We Serve
All industries Healthcare & Life SciencesAnalytics applications could include: Analytics of the revenue cycle; Analytics of the patient; Clinical operations dashboards; Analytics for Workforce; Financial performance; Monitoring operations Healthcare applications require careful analysis of security, privacy the access to data, its governance and the applicable regulations.
 Financial Services & InsuranceRisk analytics; Fraud detection; Customer analytics; Portfolio analytics; Financial reporting; Analytics of regulatory compliance
 Retail & E-CommerceSales analytics; Customer segmentation; Forecasting inventory; Marketing analytics; Pricing Analytics; Customer lifetime value
 Real Estate & PropertyProperty performance; Analytics of occupancy; Rental income; Portfolio analytics; Analytics for maintenance; Market analysis
 Transportation & LogisticsFleet analytics; Route performance; Delivery analytics; Fuel analytics; Capacity planning; Monitoring of operations
- Manufacturing & IndustrialProduction analytics; Monitoring of quality; Predictive maintenance; Supply chain analytics; Analyzing inventory; Efficiency of operations
 Construction & EngineeringPerformance of the project; Cost analysis; Planning for resource allocation; Analytics of the schedule; Procurement analytics; Risk monitoring
 Hospitality, Travel & FoodAnalytics of occupancy; Management of revenue; Customer analytics; Booking analytics; Analytics of the labor market; Operational performance
 Education & EdTechAnalytics on enrollment; Student performance; Analytics of retention; Financial dashboards; Analytics of the Workforce; Performance of institutions
 Technology & SaaSProduct analytics; Subscription analytics; Churning of customers; MRR/ARR analytics; Acquisition of customers; Analytics on usage
 Professional & Corporate ServicesProfitability of the client; Analytics of the Workforce; Financial performance; Sales pipeline; Project analytics; Resource utilization
- Government, Public Sector & NonprofitPerformance of the program; Budget analytics; Analytics for public service; Allocation of resources; Grant reporting; Operational dashboards
Our Analytics Implementation Process
- 01
Discover & Assess
We start by analyzing your goals for business, the report environment, sources of data, current issues and users, KPIs and your analytical goals.
- 02
Define Business Objectives
We determine the key decisions that the analytics solution must assist and translate those decisions into concrete requirements for analytical analysis.
- 03
Audit & Connect Data Sources
We look over the available data sources and data structures, as well as integrations, quality issues as well as permissions and dependencies before constructing the analytics environment.
- 04
Build Data & Analytics Architecture
If required, we set up models, data pipelines lakeshouses, warehouses, data marts or other structures that are ready for analytics.
- 05
Develop Dashboards & AI Models
We create dashboards, visualisations analytical models, forecasts as well as anomaly detection tools, natural-language interfaces or other necessary components.
- 06
Validate & Test
We verify calculations as well as data transformations, KPI definitions models behavior Dashboard usability, permissions, as well as business logic.
- 07
Deploy & Integrate
The solution is installed in the correct environment and then connected to the relevant systems and user workflows.
- 08
Monitor, Optimize & Scale
Analytics must change with business. We can assist with monitoring, enhancements of dashboards, new models, update, sources of data and more applications.
KPIs & Business Metrics
The best KPIs will depend on the strategy you employ. Common examples include:
Sales
- Revenue
- Pipeline Value
- Win Rate
- Conversion Rate
- Sales Cycle
- Customer Acquisition Cost
Marketing
- Leads
- Conversion Rate
- CAC
- ROAS
- Campaign ROI
- Customer Lifetime Value
Finance
- Revenue
- Gross Margin
- EBITDA
- Cash Flow
- Operating Expenses
- Budget Variance
Operations
- Productivity
- Throughput
- Utilization
- Cycle Time
- SLA Performance
- Operational Exceptions
Customer
- Retention
- Churn
- CLV
- CSAT
- NPS
- Customer Engagement
Workforce
- Headcount
- Turnover
- Time-to-Hire
- Absenteeism
- Productivity
- Workforce Utilization
We don't recommend the use of a generic KPI template for every organization.
KPIs should be a reflection of the business's mission, strategy or operating model, the industry, reporting requirements and decision-making procedures.
Security, Privacy & Analytics Governance
Analytics environments usually integrate sensitive business data in one location. This makes security and governance an integral part of the process and not as an optional extra.
Depending on the type of project, ZechionAI can address:
Engagement Models
Analytics Strategy & Advisory
For businesses that have to establish their goals for analytics or architecture KPI strategy AI, opportunities for AI, or the roadmap for transformation.
Dashboard Development
Businesses that require specific financial, operational, executive marketing, sales customer, or industry-specific dashboards.
Analytics Implementation
For businesses that require an all-inclusive analytics solution that includes modeling, data integration, visualization, BI, as well as AI capabilities.
AI Analytics Transformation
For companies that are moving away from traditional reporting to predictive, prescriptive, natural language as well as AI-assisted analysis.
Managed Analytics Services
Businesses that require ongoing monitoring of dashboards Monitoring, reporting and optimization of analytics and continual improvement.
Project-Based Analytics
To define clearly-defined analytics projects with a clear deadline, scope, deliverables and goal for implementation.
Project Scope Can Depend On
- Data sources
- Data complexity
- Amount of dashboards
- The number of users
- Requirements for integration
- AI/model complexity
- Security rules
- Reporting frequency
- Platform selection
- Support requirements for ongoing support
Why Businesses Outsource AI Data Analytics & Dashboard Development to ZechionAI
- 01
Business-First Analytics
We begin with the business decision, not the dashboard.
The aim is to comprehend what managers, leaders analysts, operational teams really have to be aware of and implement.
- 02
End-to-End Analytics Capabilities
Strategy, data integration dashboards, BI AI forecasting, analytics management, and automation can be addressed in a single analysis engagement.
- 03
Flexible Engagement Models
Companies can work with ZechionAI for a specified project, strategic advice or implementation, ongoing support for analytics, or even the longer-term plan of transformation.
- 04
Existing-System Friendly
We collaborate with CRM databases, ERP, ERP cloud environments and BI platforms, where it is practical instead of assuming that each organization must replace their technology infrastructure.
- 05
Practical AI Adoption
AI is suggested when there's an acceptable technical and business reason to use it, and not just because the addition of "AI" makes a project sound more sophisticated.
- 06
Scalable Solutions
Analytics architectures can be created to accommodate other data sources such as KPIs, users, models and dashboards. They can also be used in use scenarios as the requirements change.
- 07
Security & Governance Mindset
Access controls control, data quality, lineage, governance, security concerns and accountable AI are integrated into the overall design.
- 08
Human + AI Approach
AI can speed up analysis and help automate repetitive tasks However, human oversight is essential in the interpretation, validation or exceptions and consequent decision-making.
- 09
U.S. Business Focus
ZechionAI develops its service around the financial, operational technology and reporting, security and governance requirements commonly faced in U.S. organizations.
- 10
Cost-Conscious Delivery
We are focused on practical design and implementation options that are aligned with business needs as well as resources available and the long-term viability of our solutions.
Traditional Reporting as opposed to. AI-powered Analytics
| Traditional Reporting | AI-Powered Analytics |
|---|---|
| Manual Report creation | Automated workflows for reporting |
| Primarily, historical information | Historical and predictive analysis |
| Static reports | Interactive dashboards |
| Review of the periodic basis | Regular or continuous monitoring |
| Manual investigation | AI-assisted anomaly detection |
| Spreadsheet-heavy analysis | Connected data environments |
| Basic reporting of KPIs | Intelligent KPI monitoring |
| Analysts interpret reports in a manual manner. | AI can help in interpreting |
| Fixed questions | Exploring natural language when appropriate |
| Reactive reporting | More proactive decision support |
AI isn't a complete solution to the requirement for accurate information, expert analysts, business context or human judgement.
It expands the capabilities of analytics teams can accomplish.
Benefits of AI-Powered Analytics

Companies can make use of AI-powered analytics in order to:
Better Visibility
Convert important business data into an easier and more uniform view.
Faster Reporting
Automate the recurring reporting task and decrease the need for manual preparation.
Reduced Repetitive Work
Free business and analyst teams from manual reporting errors.
Improved Forecasting
Utilize current and historical information to make more logical estimations of the possible outcomes for the future.
Earlier Issue Detection
Find anomalies, exceptions and significant changes that merit examination.
More Consistent KPIs
Create common definitions and reporting rules across departments.
Better Operational Decisions
Provide teams with more frequent insight into the performance of their operations.
Stronger Financial Visibility
Help the management understand margins, costs, revenues as well as cash flow the performance of the business against its goals.
Improved Customer Understanding
Analyze the customer journeys, segments retention, conversion and behaviour.
More Informed Resource Allocation
Utilize data to aid in capacity, staffing and inventory, budget as well as operational decision-making.
Scalable Analytics
Build a base that will be used to support other users, data sources, dashboards and analysis scenarios.
More under Data & AI Intelligence
- Predictive AnalyticsTurn Historical and Real-Time Data Into Better Business Decisions
 Recommendation EnginesAI Powered Recommendation Engine Services for more relevant customer experiences.
 Sentiment AnalysisConduct in-depth customer feedback, conversations, and reviews to derive actionable sentiment intelligence.
- Fraud DetectionDetect Meaningful Risk. Reduce Unnecessary Friction. Strengthen Fraud Operations.
AI-powered data analytics combine traditional data analytics and business intelligence AI techniques like machine learning, natural-language querying predictive modeling, anomaly detection and automated analysis generation.
Traditional BI typically focuses in reporting as well as understanding past performance. AI-powered BI can include capabilities like the ability to predict analytics, anomaly detecting natural-language interaction, automatic interpretation, and even recommendation support.
We design executive sales, financial marketing, operations, HR, workforce, customer supply chain Project, real-time monitoring and specific industry-specific dashboards.
Yes. Based on the specific environment the data can be incorporated from APIs, databases, ERP systems, CRM systems and spreadsheets, cloud-based apps, platforms for marketing operating systems, as well as various other sources.
Yes. If needed, we are able to use an existing BI environment, rather than needing a complete replacement of the platform.
Yes. The ERP data and the CRM information could provide valuable data for dashboards and forecasting customer analytics, financial reporting, sales intelligence as well as other applications that require analysis.
Predictive analytics rely on data from the past and present to forecast future results. It is able to assist in forecasting revenue, sales, demand and inventory levels, churn needs for workforce, as well as other business variables.
Certain dashboards can be created to allow near-real-time or immediate updates, based on the base system, the data design, integration technique platform capabilities, and the business needs.
Yes. Recurring KPI reports schedule dashboards executive summaries and exception reports, and various other report workflows are often automated.
Natural-language analytics allow authorized users to inquire regarding business information using a normal languages instead of manually making analytical queries.
Yes, if the environment for data supports it. The appropriate access controls such as data definitions, security, permissions and governance needs to be in place prior to the deployment of general conversational analytics.
Anomaly detection is a method of identifying information points, transactions patterns or trends that are significantly different from the expected patterns. These findings are then evaluated by the right personnel.
No. An anomaly could have a variety of legitimate reasons. Analytics can identify unusual activities to be investigated, but it cannot independently demonstrate fraud.
Yes. Assessment of data quality, cleaning and transformation and validation, monitoring and even governance can be integrated into the implementation of analytics.
The length of time varies greatly. A dashboard that is focused can be significantly smaller than an enterprise-level analytics transformation that requires many systems, a complex data architectures, AI models, security requirements, and a lot of users.
Yes. Old dashboards can be evaluated or revamped, consolidated, transferred or integrated based on the technology in place and the business needs.
Yes. Engagements could include monitoring and management of dashboards, reports and monitoring, as well as optimization model integration, data integration and other analytics development.
Yes. AI analytics doesn't necessarily require a large-scale enterprise. The right solution must be compatible with the level of data maturity in your organization budget, operations complexity and the business's priorities.
Security is dependent on the conditions and requirements of the project. The most appropriate measures could include security-related integrations, role-based access and control of access and encryption issues and monitoring, governance and control of data quality.
Yes. Solutions for analytics can be developed around specific industry workflows KPIs, reporting needs data sources, as well as operational procedures.
We take into consideration the control of access, quality data validation, oversight by humans accountability, auditability models, limitations on models, and rules of governance for organizations when AI is integrated into analytics.
Turn Your Business Data Into Better Decisions
Most likely, you don't need additional information.
Talk to Zech, live